SEC EDGAR API for Financial Statements: Income, Balance, Cash Flow (2026)
You want a company's numbers. Revenue, profit, assets, cash. SEC EDGAR has all of it, for free, for every public company in the US.
Then you open the filing and it's XBRL. Thousands of tags, the same line item labeled five different ways, and a padding rule you have to remember. Free data, and a genuinely miserable afternoon.
Here is what the three financial statements are, why the raw version is so painful, and how to pull all three as JSON in a single call.
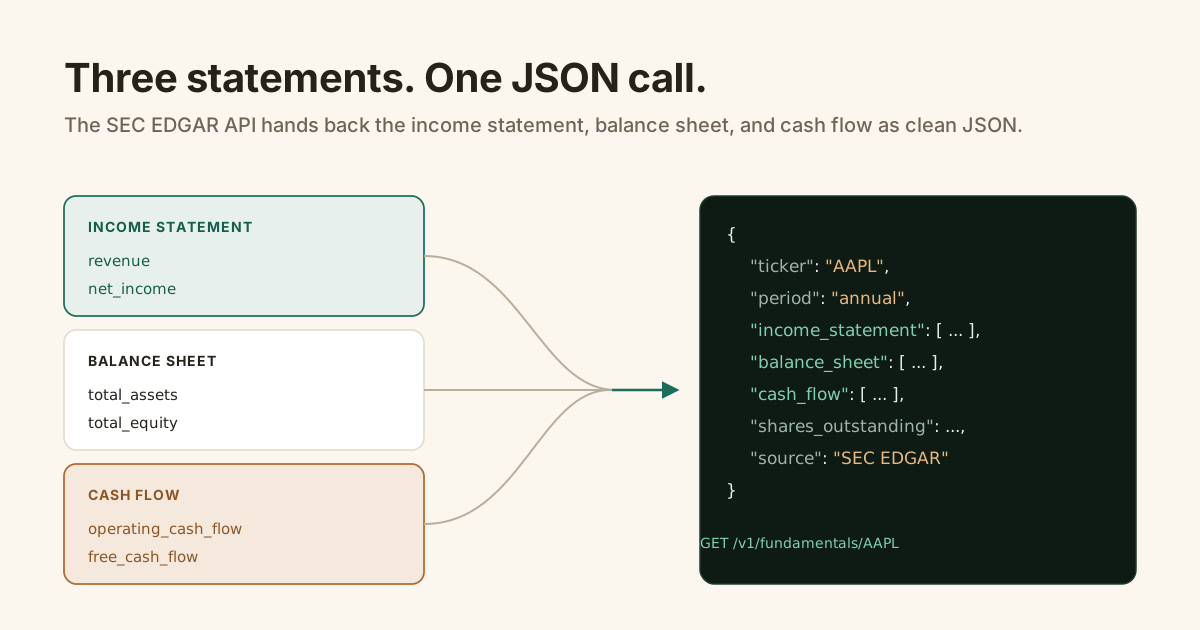
The SEC EDGAR API returns a company's three core financial statements as clean JSON. One call to /v1/fundamentals/{ticker} gives you the income statement, the balance sheet, and the cash flow, each line item already mapped from its raw XBRL tag to a plain field like revenue or net_income. No tag decoding, no per-company special cases.
GET /v1/fundamentals/{ticker}, as three arrays of flat named fields, with the raw XBRL tags already normalized for you. Add period=quarterly for 10-Q numbers or period=annual for the 10-K.What are the three financial statements?
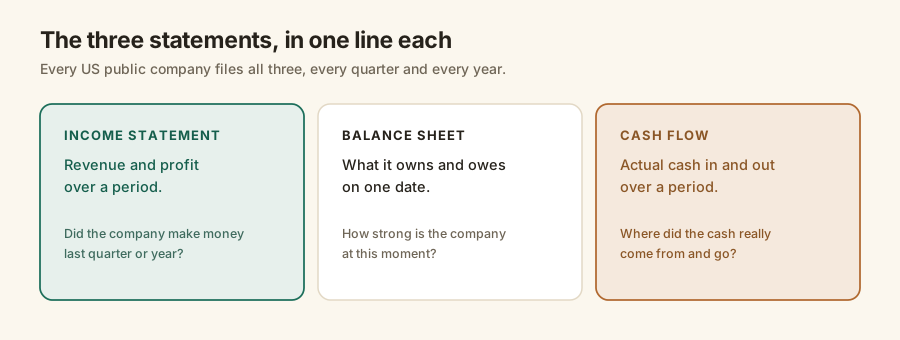
The three financial statements are the income statement, the balance sheet, and the cash flow statement. The income statement shows revenue and profit over a period. The balance sheet is a snapshot of what a company owns and owes on a single date. The cash flow statement tracks the actual cash moving in and out. Every US public company files all three, every quarter and every year.
They answer three different questions.
The income statement asks: did the company make money last period? Revenue at the top, expenses in the middle, net income at the bottom.
The balance sheet asks: how strong is it right now? Assets on one side, liabilities and equity on the other, and the two always balance.
The cash flow statement asks: where did the cash really come from? Profit is an accounting number. Cash is cash. A company can be profitable on paper and still run out of it.
Which statements does the SEC EDGAR API return?
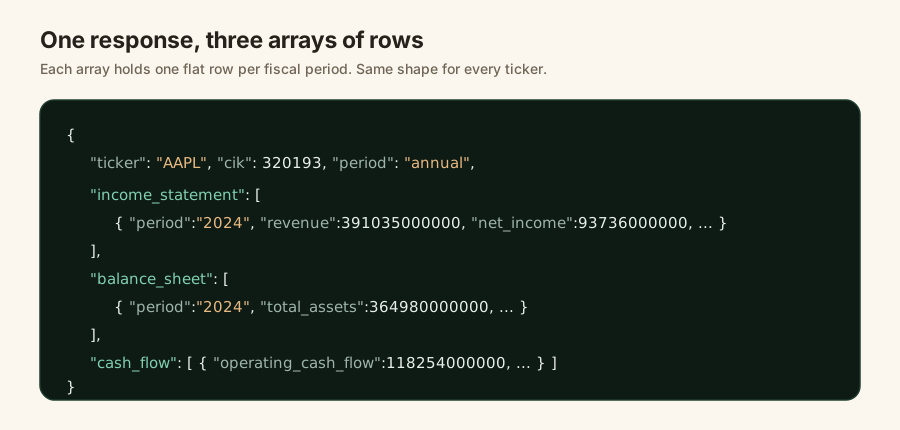
Edgrapi's fundamentals endpoint returns all three. A call to /v1/fundamentals/{ticker} comes back with income_statement, balance_sheet, and cash_flow arrays, one row per fiscal period, plus the ticker, CIK, and shares outstanding. Each row is flat named fields, so revenue, net_income, total_assets, and operating_cash_flow are keys you read straight off the JSON.
Every row carries a period label so you know which year or quarter it is.
The shape is the same for every ticker, which is the part that matters when you build on it.
The underlying numbers come straight from the company's own XBRL filings on SEC EDGAR, so they match the 10-K and 10-Q line for line. The API's job is not to change the data. It is to make it readable.
Why is pulling statements from raw XBRL so hard?
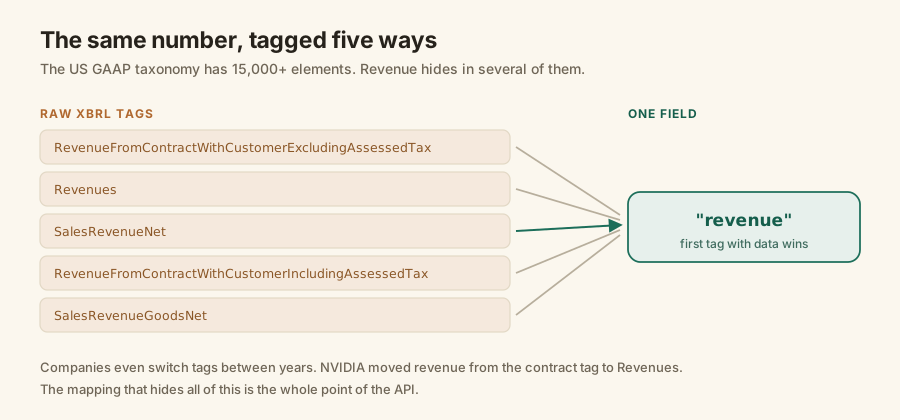
Because the same line item is tagged differently across companies and years. The US GAAP financial reporting taxonomy has more than 15,000 elements, and a company can report revenue under any of several of them. The SEC has required this tagging since it phased in Inline XBRL for large filers, starting with fiscal periods ending on or after June 15, 2019. So the data is public and free, and also a pain to normalize by hand.
Take revenue. One company tags it RevenueFromContractWithCustomerExcludingAssessedTax. Another uses plain Revenues. An older filing uses SalesRevenueNet.
Pick the wrong tag and you get a blank, or worse, a number that looks right and isn't.
It gets harder. Companies switch tags between years, so NVIDIA moved its revenue from the contract tag to Revenues partway through its history. Your parser has to follow that.
Then there's the quarterly trap. A raw 10-Q mixes true three-month figures with trailing-twelve-month windows, and if you don't filter them your Q3 revenue is silently wrong.
The SEC did not build EDGAR to be convenient. It built it to be complete, and completeness in the SEC's structured data means every edge case is your problem. I wrote a longer field guide to this in why parsing SEC EDGAR XBRL is harder than it looks.
A hosted API exists so you write that mapping zero times instead of once per project.
How do you get all three statements in one call?
You call the fundamentals endpoint with a ticker and read the three arrays off the response. With Edgrapi the statements live at /v1/fundamentals/{ticker}, your key goes in the X-API-Key header, and period=annual or quarterly picks the cadence. One request, all three statements, already normalized.
import requests

r = requests.get(
    "https://api.edgrapi.com/v1/fundamentals/AAPL",
    headers={"X-API-Key": "edgr_your_key"},
    params={"period": "annual", "limit": 5},
)
data = r.json()

latest = data["income_statement"][0]
print(latest["period"], latest["revenue"], latest["net_income"])
# 2024 391035000000 93736000000
That's the whole thing. Swap AAPL for any ticker and the same key works across the rest of the API.
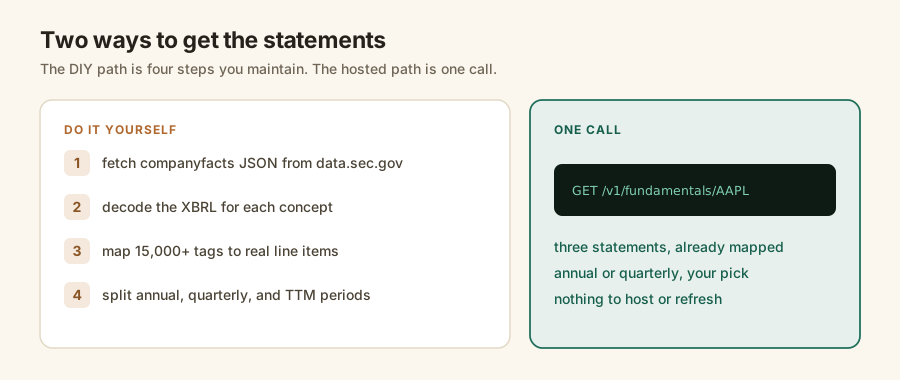
Under the hood you're reading the annual numbers from the company's 10-K filings and the quarterly numbers from its 10-Q filings, both keyed on the CIK the API resolves from your ticker.
How do you pull statements for many companies at once?
You loop the same call over your tickers, one request per ticker, so a 50-name watchlist is 50 calls. The response shape is identical every time, which means you can stack the rows straight into a dataframe or a database without reshaping per company. Each call reports its exact credit cost in the X-Credits-Cost header.
import requests

tickers = ["AAPL", "MSFT", "NVDA", "KO", "JPM"]
rows = []

for t in tickers:
    r = requests.get(
        f"https://api.edgrapi.com/v1/fundamentals/{t}",
        headers={"X-API-Key": "edgr_your_key"},
        params={"period": "annual", "limit": 1},
    )
    inc = r.json()["income_statement"][0]
    rows.append({"ticker": t, "revenue": inc["revenue"], "net_income": inc["net_income"]})

# rows is now a clean table, ready for pandas or a DB insert
Because the fields are named and consistent, the row for a bank lines up with the row for a soda company. No per-ticker branching.
The free tier is 100 credits to try this on a real list. Above that it's metered credits, so a bigger backfill just spends more of them.
Income statement vs balance sheet vs cash flow: what fields do you get?
Each statement returns its standard line items as named fields. The income statement runs from revenue down to net_income and EPS. The balance sheet carries total_assets, total_liabilities, and total_equity. The cash flow statement carries operating, investing, and financing cash flow, plus a derived free_cash_flow. Here is the field map.
| Statement | JSON key | Key fields you get |
|---|---|---|
| Income statement | income_statement | revenue, cost_of_revenue, gross_profit, operating_income, pretax_income, income_tax, net_income, eps_basic, eps_diluted |
| Balance sheet | balance_sheet | total_assets, current_assets, cash_and_equivalents, inventory, total_liabilities, current_liabilities, long_term_debt, total_equity |
| Cash flow | cash_flow | operating_cash_flow, investing_cash_flow, financing_cash_flow, capital_expenditure, dividends_paid, free_cash_flow |
A couple of those fields are derived, not tagged. When a company doesn't report gross profit directly, the API fills it as revenue minus cost of revenue. Free cash flow is operating cash flow minus capital expenditure.
If you want the ratios built on top of these, like margins and return on equity, the full SEC EDGAR API guide covers the ratios endpoint that keys off the same data.
Can an AI agent read a company's financial statements?
Yes, through MCP, the Model Context Protocol. Edgrapi runs a hosted MCP server at https://api.edgrapi.com/mcp with a get_fundamentals tool, so an AI client can pull a company's income statement, balance sheet, and cash flow in the same conversation and reason over them.
Ask an assistant wired to the API "how did Microsoft's margins move last year," and it pulls the statements, does the math, and answers with the actual numbers instead of a guess.
That's the difference between an agent that sounds confident and one that's reading the filing.
Start with one statement
Grab a free key, call /v1/fundamentals on a ticker you know, and read the three statements off the JSON.
The free tier is 100 credits / month, no card, enough to pull your whole watchlist and wire up whatever comes next. Point it at https://api.edgrapi.com and pull your first company.
Frequently asked questions
How do I get a company's financial statements from an API?
You call a fundamentals endpoint with the ticker and read the statements off the JSON. With Edgrapi, GET https://api.edgrapi.com/v1/fundamentals/AAPL and an X-API-Key header returns the income statement, balance sheet, and cash flow as three arrays of flat named fields. The data is SEC EDGAR filings, already mapped from raw XBRL tags, so you skip the parsing entirely.
Does the SEC EDGAR API return the income statement, balance sheet, and cash flow?
Yes. One call to /v1/fundamentals/{ticker} returns all three as separate arrays: income_statement, balance_sheet, and cash_flow, with one row per fiscal period. Each row is flat named fields like revenue, net_income, total_assets, and operating_cash_flow, so you read the values directly instead of decoding XBRL concepts.
How do I get SEC financial data as JSON without parsing XBRL?
Use a hosted API that does the XBRL mapping for you. SEC EDGAR publishes financials as XBRL, where the same line item can carry any of thousands of tags. Edgrapi maps those tags to plain fields and serves clean JSON, so GET /v1/fundamentals/{ticker} hands back revenue and net_income as keys with no tag decoding on your side.
Are SEC financial statements free through the API?
The underlying data is free from the SEC, which publishes company financials as XBRL on data.sec.gov. The cost is the work of normalizing it. Edgrapi wraps that in a hosted call with a free tier of 100 credits and no credit card, then metered credits above that, so you pay for the convenience, not the data.
Can I get quarterly financial statements, not just annual?
Yes. Add period=quarterly to the fundamentals call and you get the quarterly income statement, balance sheet, and cash flow from the company's 10-Q filings. Use period=annual for the 10-K numbers. The API filters out the trailing-twelve-month figures that make raw quarterly XBRL confusing, so each row is a true single quarter.
What is the difference between the three financial statements?
The income statement shows revenue and profit over a period. The balance sheet is a snapshot of what a company owns and owes on one date. The cash flow statement tracks the actual cash moving in and out over a period. Every US public company files all three, and the SEC EDGAR API returns all three from one fundamentals call.