SEC EDGAR API for Financial Ratios: Margins, ROE, Leverage as JSON (2026)
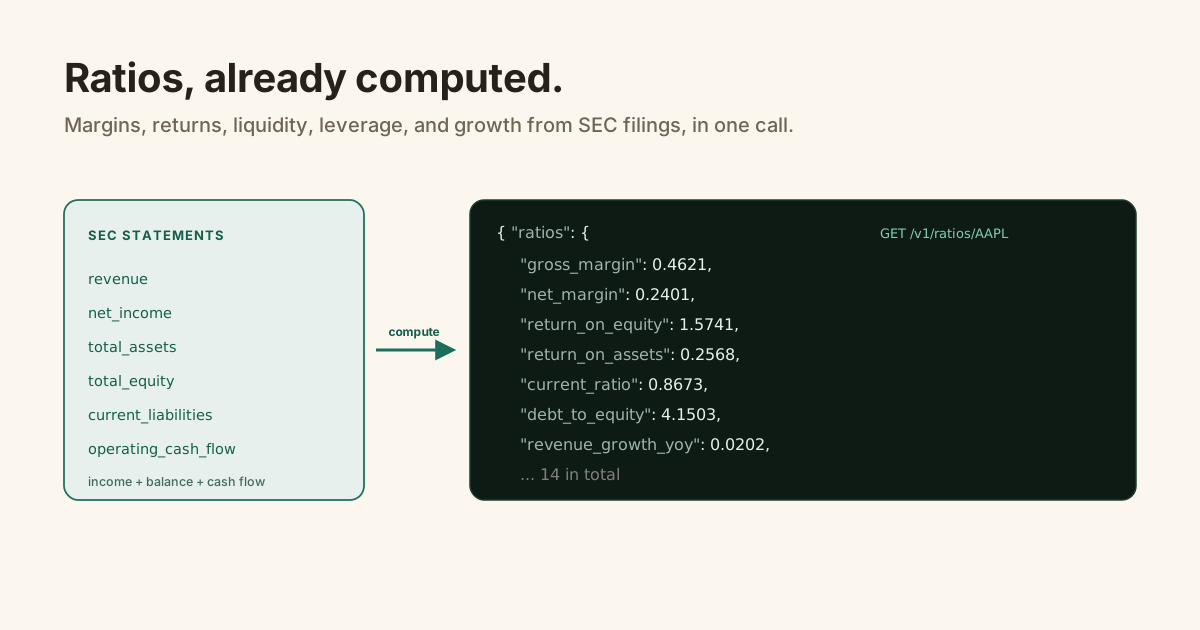
You want a company's margins, its return on equity, whether it can cover its short-term bills. Ratios, in other words.
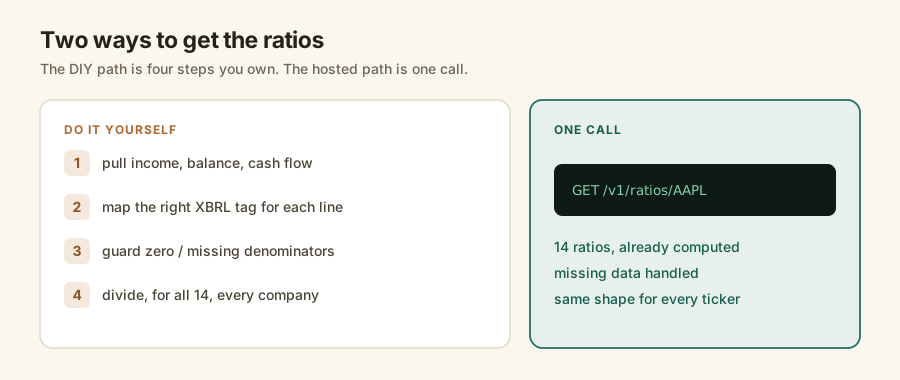
They all live inside the financial statements already. Net margin is just net income over revenue. The catch is that "just" hides a lot: mapping the right XBRL tag for each field, then guarding every division against a missing or zero denominator, for fourteen ratios, for every company.
The SEC EDGAR API returns a company's financial ratios as JSON once a wrapper does that work. A single call to /v1/ratios/{ticker} gives you 14 computed ratios from the latest fiscal year: margins, returns, liquidity, leverage, and growth, each already divided out and handled for missing data. The one thing it cannot give you is any ratio with a stock price in it, because EDGAR has filings, not prices.
GET /v1/ratios/{ticker}: margins, ROE, ROA, liquidity, leverage, and growth. What it can't return is price-based ratios (P/E, P/B, yield). Those need a live market price EDGAR doesn't carry.Which financial ratios come from SEC filings?
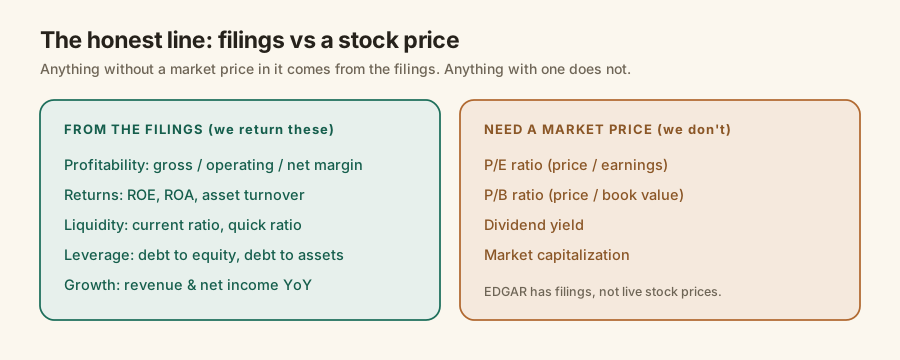
Any ratio built only from the three statements. Financial ratios group into families, and the standard set is profitability, liquidity, solvency (leverage), and efficiency, plus valuation. Every family except valuation is computed from the income statement, balance sheet, and cash flow, so every family except valuation is fully derivable from a company's SEC filings.
Profitability is margins and returns: how much of each revenue dollar becomes profit, and how much profit each dollar of equity or assets earns.
Liquidity is short-term survival: can current assets cover current liabilities.
Leverage is how much of the company is funded by debt versus equity. Efficiency is how hard the assets work to produce sales.
Which ratios does the SEC EDGAR API return?
Edgrapi's ratios endpoint returns 14, computed from the latest fiscal year. A call to /v1/ratios/{ticker} comes back with five margins, return on equity and assets, asset turnover, current and quick ratios, debt to equity and assets, and year-over-year growth for revenue and net income. Each value is a plain number you read off the JSON.
They're grouped by family, which is how you'd actually reason about a company.
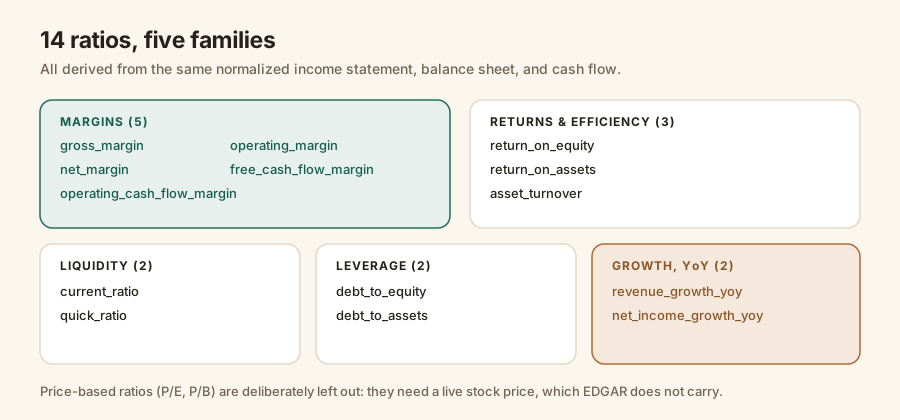
Here is the full list with what each one divides.
| Family | Ratio (JSON key) | What it divides |
|---|---|---|
| Margins | gross_margin | gross profit / revenue |
operating_margin | operating income / revenue | |
net_margin | net income / revenue | |
operating_cash_flow_margin | operating cash flow / revenue | |
free_cash_flow_margin | free cash flow / revenue | |
| Returns & efficiency | return_on_equity | net income / total equity |
return_on_assets | net income / total assets | |
asset_turnover | revenue / total assets | |
| Liquidity | current_ratio | current assets / current liabilities |
quick_ratio | (current assets − inventory) / current liabilities | |
| Leverage | debt_to_equity | total liabilities / total equity |
debt_to_assets | total liabilities / total assets | |
| Growth (YoY) | revenue_growth_yoy | change in revenue vs prior year |
net_income_growth_yoy | change in net income vs prior year |
Why can't you get the P/E ratio from the SEC EDGAR API?
Because the P/E ratio needs a stock price, and a filing doesn't contain one. P/E is price divided by earnings per share: the filing gives you the earnings, but the price comes from the market and moves every second. A document filed once a quarter can't hold a number that changes that fast.
So any valuation ratio is off the table from filings alone.
P/E, price-to-book, dividend yield, and market cap all fold in a live share price. To compute those you take the filing-derived numbers (earnings, book value, dividends) and pair them with a market-data feed, which is a different product than an EDGAR wrapper.
This is worth being honest about rather than pretending otherwise. An SEC ratios API is complete for everything the company reported about itself, and silent on how the market prices it.
How do you get a company's ratios in one call?
You call the ratios endpoint with a ticker and read the numbers off the response. With Edgrapi the ratios live at /v1/ratios/{ticker}, your key goes in the X-API-Key header, and the response is the 14 ratios plus a note about the price-based ones it leaves out.
import requests

r = requests.get(
    "https://api.edgrapi.com/v1/ratios/AAPL",
    headers={"X-API-Key": "edgr_your_key"},
)
ratios = r.json()["ratios"]
print(ratios["net_margin"], ratios["return_on_equity"], ratios["current_ratio"])
# 0.2401 1.5741 0.8673
That's the whole thing. No statements to fetch first, no tags to map, no division to write.
If you'd rather see the raw numbers the ratios come from, the fundamentals endpoint returns the statements themselves, and the XBRL-to-JSON post covers why those need normalizing first.
How are the ratios actually computed?
Each ratio is a division of two named fields the API already returns. Return on equity is net_income over total_equity. Net margin is net_income over revenue. The API reads both fields from the normalized statements, divides, rounds, and returns None when a denominator is missing or zero, so a thin filer doesn't crash your code.
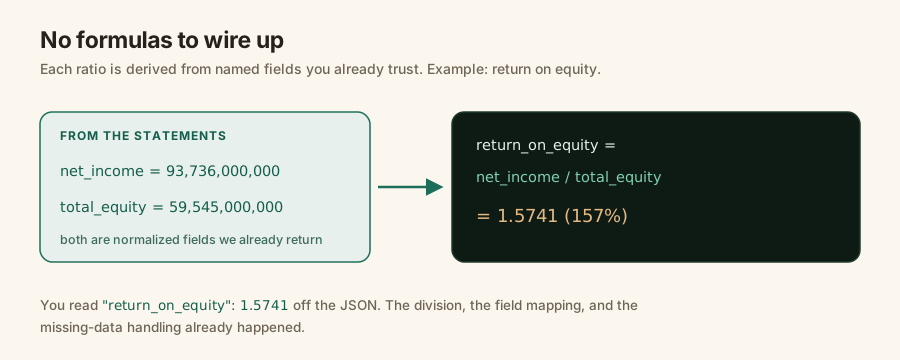
Nothing here is secret math. The value is in not writing it fourteen times and not maintaining it as companies file with different tags. That mapping is the same one behind the whole SEC EDGAR API.
How do you compare ratios across companies?
You call the endpoint per ticker and line the numbers up. Because every response has the same keys, two companies compare field for field with no reshaping: put KO's net_margin next to PEP's, or rank a whole watchlist by return_on_equity.
If you just want to eyeball two companies without writing anything, the free comparison tool puts their margins, returns, and growth side by side in the browser.
For a screener across many names, loop the call and each ticker is one request. The alternatives roundup covers how this stacks up against other SEC data options.
Can an AI agent pull financial ratios?
Yes, through MCP. Edgrapi runs a hosted MCP server at https://api.edgrapi.com/mcp with a get_ratios tool, so an AI client can pull a company's ratios and reason about them in the same conversation.
Ask an assistant wired to the API "is Coca-Cola more profitable than Pepsi," and it pulls both sets of margins and answers from the actual numbers instead of a vague impression.
Start with one company's ratios
Grab a free key, call /v1/ratios on a company you have an opinion about, and see whether the numbers back you up.
The free tier is 100 credits a month, no card, enough to rank a whole watchlist by margin or return. Point it at https://api.edgrapi.com and pull your first set.
Frequently asked questions
Can I get financial ratios from the SEC EDGAR API?
Yes. The SEC's own API gives you the raw statements, and a wrapper computes the ratios. Edgrapi's GET /v1/ratios/{ticker} returns 14 computed ratios as JSON, from the latest fiscal year: margins, return on equity and assets, current and quick ratios, debt to equity and assets, and year-over-year growth. All derived from the company's own filings.
Which financial ratios come from SEC filings?
Every ratio built only from the income statement, balance sheet, and cash flow: profitability (margins), returns (ROE, ROA), efficiency (asset turnover), liquidity (current, quick), leverage (debt to equity and assets), and growth. What you cannot get from filings alone is any ratio that includes a stock price.
Why isn't the P/E ratio in the SEC EDGAR API?
Because the P/E ratio needs a live stock price, and SEC EDGAR has filings, not market prices. A filing gives you earnings; the price comes from the market and changes every second. The same is true of price-to-book, dividend yield, and market cap. For those you add a separate market-data feed on top of the filing-derived ratios.
How do I calculate ROE or margins from SEC data?
ROE is net income divided by total equity; net margin is net income divided by revenue; gross margin is gross profit divided by revenue. All three fields come straight from a company's filings. Doing it by hand means mapping each field's XBRL tag and guarding zero denominators. Edgrapi returns the computed ratio directly so you skip that.
Is there a free API for financial ratios?
The SEC's API is free but returns raw XBRL, so you compute the ratios yourself. Free libraries like edgartools help if you self-host in Python. Hosted wrappers add free tiers: Edgrapi computes the ratios and serves them as JSON with 100 free credits a month and no card.
How many financial ratios does Edgrapi compute?
Fourteen, from the latest fiscal year: five margins (gross, operating, net, operating cash flow, free cash flow), return on equity, return on assets, asset turnover, current ratio, quick ratio, debt to equity, debt to assets, and year-over-year revenue and net income growth. Price-based ratios are left out on purpose.