13F Holdings API: See What a Fund Bought and Sold
Everyone wants to know what the big funds are buying. The data is public every quarter. The catch is that the raw filing is almost unusable, and it's the changes that matter, not the snapshot.
A 13F holdings API turns a fund's quarterly SEC filing into clean JSON, so you can see its positions and, more usefully, what it bought and sold since last quarter. Institutional managers with over $100 million must file Form 13F within 45 days of each quarter-end, listing every US stock position. The raw filing uses CUSIPs, splits holdings across sub-managers, and mixes in options, so a good API parses all of that and diffs it against the prior quarter.
/v1/holdings/{fund} takes a name, CIK, or filer ticker, resolves CUSIPs to tickers, aggregates sub-managers, flags puts, and labels every position new, added, reduced or exited. Read it as lagged history, not a live feed.What is a 13F holdings API?
A 13F holdings API is a service that parses SEC Form 13F filings into structured data. Every institutional manager with more than $100 million in US equities files a Form 13F each quarter, disclosing each position's issuer, CUSIP, market value, and shares. The API reads that filing from SEC EDGAR and returns it as JSON, usually with tickers resolved and quarter-over-quarter changes computed, so you don't parse XML or map CUSIPs yourself.
The point is turning a legal document into usable data.
The raw 13F, the Form 13F-HR information table, is meant for regulators, not developers. It's accurate but awkward.
A 13F holdings API does the boring, error-prone middle: it pulls the filing, aggregates the positions, resolves the tickers, and tells you what changed. That's the difference between "the data exists" and "I can build with it."
How do I get a fund's 13F holdings as JSON?
You call a holdings endpoint with the fund's identifier and get its latest 13F portfolio back as JSON. With Edgrapi, that's a GET to /v1/holdings/{identifier}, where the identifier is a known fund name like berkshire, a CIK, or a filer ticker like BRK-B. It returns each position ranked by value, with the issuer, resolved ticker, dollar value, shares, and percent of the book.
Here's a request for Berkshire Hathaway.
curl "https://api.edgrapi.com/v1/holdings/berkshire?limit=10" \
  -H "Authorization: Bearer YOUR_EDGRAPI_KEY"
You get a ranked list of positions.
{
  "manager": "Berkshire Hathaway Inc",
  "quarter": "2026-06-30",
  "positions": [
    { "issuer": "APPLE INC", "cusip": "037833100", "ticker": "AAPL",
      "value": 84200000000, "shares": 300000000, "percent": 24.1,
      "change": "reduced", "put_call": null }
  ],
  "source": "SEC EDGAR Form 13F-HR (information table)"
}
Name resolution is the convenience. You don't need to know Berkshire's CIK, because the API maps well-known managers (berkshire, burry, ackman, bridgewater, citadel) to the right filer for you, and still accepts a raw CIK for the rest.
Which famous funds can I track by name?
The big-name managers people actually want are mapped to a simple keyword. With Edgrapi you can pass berkshire for Warren Buffett, burry for Michael Burry's Scion, ackman for Pershing Square, plus Bridgewater, Citadel, and other well-known filers, and get the right 13F without hunting for a CIK. For everyone else, a raw CIK or a filer ticker still works.
This is the difference between a demo and a real tool.
Nobody remembers that Berkshire's filer CIK is a ten-digit number. They remember "Buffett," so the API meets them there.
The famous-name shortcut covers the funds that drive most of the search interest: the value legends, the big activists, and the quant shops. For a boutique fund with no nickname, you fall back to its CIK, which the SEC lists on the filer's EDGAR page.
So the same endpoint serves both the "what does Buffett own" crowd and the analyst tracking an obscure manager by CIK, which is exactly the pattern a fund-watchlist tool needs.
How do I see what a fund bought and sold last quarter?
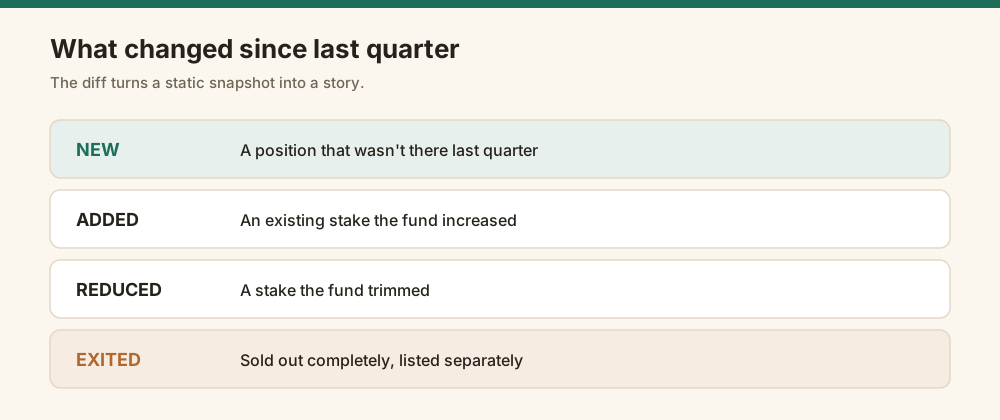
You use the quarter-over-quarter diff, which is the real reason to track 13F. A good holdings API compares the latest filing to the prior one and labels every position: new, added, reduced, or unchanged, with exited positions listed separately. That turns a static snapshot into a story, what the fund is building a stake in, trimming, or dumping.
This is where the value lives.
Nobody refreshes a 13F to re-read Apple at 24 percent of the book. They refresh it to catch the new position that wasn't there last quarter.
With Edgrapi, the diff is on by default. Each position carries a change field, and the response lists exits separately, so a scan for "change": "new" surfaces exactly what the fund started buying.
curl "https://api.edgrapi.com/v1/holdings/burry?changes=true" \
  -H "Authorization: Bearer YOUR_EDGRAPI_KEY"
For a fund like Scion (Michael Burry), where the whole interest is the new bets and the exits, the changes are the product. The full holdings table is almost a side effect.
Read the tags together for the real picture. A page of unchanged positions with one new name at the bottom is a fund quietly starting a stake, while a cluster of reduced and exited is a fund stepping back from a sector.
The exits deserve their own attention. A position that was there last quarter and gone this one often says more than a new buy, because selling a 13F holding is a deliberate move a manager knows will be public. Watching the exit list is how you catch a fund losing conviction before the headlines do.
Why are 13F holdings in CUSIPs, not tickers?
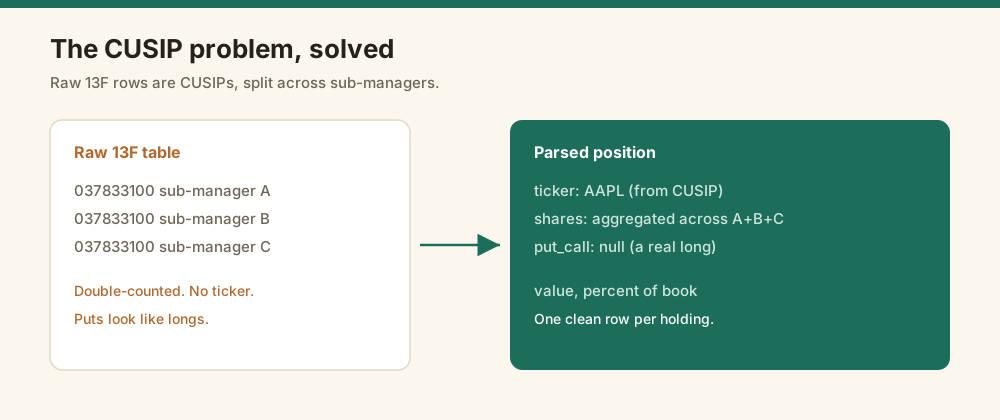
Because the SEC identifies securities by CUSIP, not ticker, and one holding can be split across sub-managers. A 13F information table lists a nine-character CUSIP per position, so a raw feed hands you 037833100 instead of AAPL. Worse, a large fund files through multiple sub-managers, so the same holding appears several times and the raw table double-counts it. A good API resolves the CUSIP to a ticker and aggregates the duplicates.
Two problems hide in that table.
First, CUSIPs aren't tickers. You need a CUSIP-to-ticker crosswalk to make the data readable, and that mapping isn't free or complete, so bonds and foreign issues often have no US ticker at all.
Second, sub-manager splits. Berkshire, for instance, reports through several entities, so a single Apple position can show up as three rows that you must sum to get the real stake.
Edgrapi handles both: positions are aggregated by CUSIP across sub-managers, and each carries a best-effort ticker, with the issuer name and CUSIP staying authoritative when a ticker can't be resolved.
What does 13F data not tell you?
A lot, and the gaps are where naive trackers go wrong. 13F is long-only, so it never shows short positions. It's quarterly and filed up to 45 days late, so it's a lagged snapshot, not a live trade feed. It can include put and call options, which are not the same as owning the stock. And amendments can restate a filing after the fact. Read 13F as history, not signal.
Four limits are worth stating plainly.
It's long-only. Short positions and most bonds never appear, so a fund that's net bearish can look bullish from its 13F alone.
It's stale. A position dated June 30 might not publish until mid-August, and the fund may have already sold it before you ever see the filing, so treat every number as where a manager stood at quarter-end, not where they stand today.
Options mislead. A 13F can list a PUT on a stock, which is a bearish bet. Reporting that as a "holding" is the classic 13F mistake, which is why a serious API flags each option with a put_call field.
And it's revisable. A 13F/A amendment can change the record later, sometimes to reveal positions a fund kept confidential at first. The SEC's 13F FAQ spells out exactly what is and isn't reportable, which is worth reading before you trust a number.
How do I track a fund every quarter?
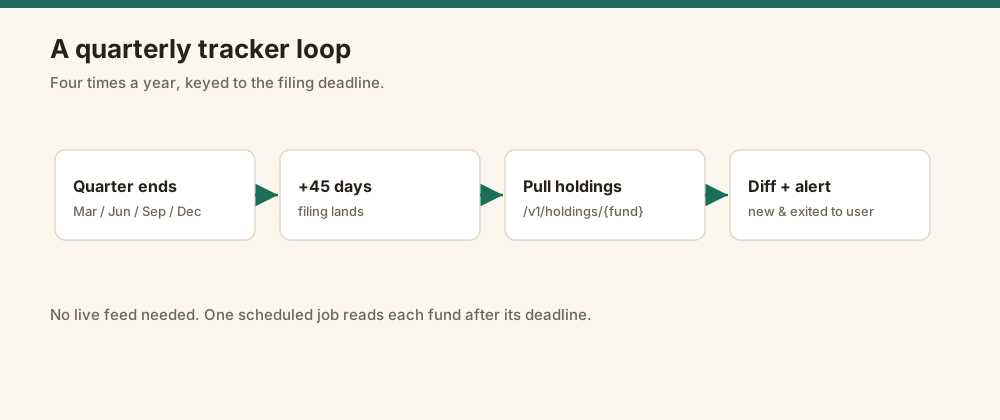
You poll the holdings endpoint once a quarter and diff against what you stored. Because 13F only updates four times a year, a tracker is simple: after each quarter's 45-day deadline, pull the fund's latest holdings, compare to your saved copy, and alert on anything tagged new or exited. You don't need a live feed, just a scheduled check keyed to the filing calendar.
The rhythm follows the SEC calendar.
Quarters end in March, June, September, and December, and filings land within 45 days, so mid-February, mid-May, mid-August, and mid-November are when new data appears.
Store each pull by fund and quarter. When a new filing shows up, the API's change tags do the comparison for you, so your job is just to watch for new and exited and push those to a user.
For a single fund, that's a handful of calls a year. For a watchlist of managers, it's one scheduled job that reads each one after the deadline and surfaces the moves. Since empty or unchanged responses cost you almost nothing, a wide watchlist is cheap to run and you only pay real attention when something actually moves.
What can you build with a 13F holdings API?
Most useful 13F tools are one of three things: a whale tracker, a consensus finder, or an alert. A whale tracker follows a set of famous managers and shows what each bought and sold. A consensus finder looks across many funds to see which stock the smart money is crowding into. An alert watches a fund or a ticker and pings a user when something changes. All three run on the same parsed, diffed data.
Each is a small idea with real pull.
A whale tracker is the classic. Pull ten famous funds each quarter, surface the new positions, and you have a newsletter or a dashboard people actually open.
A consensus view is subtler and more valuable. Count how many tracked funds hold a given ticker, or newly bought it, and you surface the names the crowd is quietly accumulating.
An alert is the stickiest. A user follows Scion or a specific stock, and when the next 13F lands with a new position or an exit, they hear about it first.
None of these needs live data or a trading feed. They need a fund's holdings, the quarter-over-quarter change, and a schedule, which is exactly what a 13F holdings API provides.
13F holdings API options compared
The right 13F source depends on whether you want raw filings or parsed, diffed data. SEC EDGAR is the free primary source but hands you unparsed XML. WhaleWisdom offers deep 13F history behind a subscription. sec-api.io and various scrapers provide structured filings. Edgrapi returns a fund's holdings with tickers resolved, sub-managers aggregated, options flagged, and quarter-over-quarter changes computed, on one key.
Here's how the sources compare.
| Source | Output | Ticker resolution | QoQ changes | Access |
|---|---|---|---|---|
| SEC EDGAR | Raw 13F-HR XML | No (CUSIP only) | No | Free, parse it yourself |
| WhaleWisdom | Deep 13F history | Yes | Yes | Subscription |
| sec-api.io | Structured filings | Partial | Compare two filings | Paid API |
| Apify scrapers | Scraped JSON | Varies | Some | Per-run pricing |
| Edgrapi | Parsed JSON + diff | Yes | Yes, by default | Free tier, credit-metered |
Read it by how much parsing you want to own.
Want the raw truth and don't mind the work? SEC EDGAR is free and authoritative, and you build the CUSIP crosswalk and the diff yourself.
Want it parsed, ticker-resolved, and diffed without running a pipeline? A hosted API like Edgrapi or WhaleWisdom does that, trading the free-but-manual route for less work. There's a matching MCP tool, get_holdings, so an AI agent can pull a fund's moves directly.
Track the changes, not the snapshot
If you're building anything on 13F, decide first what you actually want. A static list of a fund's holdings is easy and mostly useless. The buys and sells since last quarter are the story, so make the quarter-over-quarter diff the center of your tool.
Pull a fund's holdings by name or CIK, watch the change tags for new positions and exits, and respect the limits: long-only, quarterly, and up to 45 days stale. For the full endpoint reference, see the SEC EDGAR 13F API guide. Then point a holdings endpoint at your favorite fund and see what it started buying last quarter, which is the only 13F question most people are really asking.
Frequently asked questions
What is a 13F holdings API?
A 13F holdings API parses SEC Form 13F filings into structured JSON. Institutional managers with over $100 million in US equities file a 13F-HR each quarter listing every position's issuer, CUSIP, value, and shares. The API reads that filing from SEC EDGAR and returns it as clean data, usually with tickers resolved from CUSIPs and quarter-over-quarter changes computed, so you skip parsing XML and mapping identifiers yourself.
How do I get a hedge fund's holdings as JSON?
Call a holdings endpoint with the fund's identifier. With Edgrapi, GET /v1/holdings/{identifier} accepts a known fund name like berkshire, a CIK, or a filer ticker like BRK-B, and returns the latest 13F portfolio ranked by value, with issuer, resolved ticker, dollar value, shares, and percent of the book. Well-known managers map automatically, so you don't need to look up a CIK for the famous ones.
How do I track quarter-over-quarter changes in a fund's 13F?
Use an API that diffs the latest filing against the prior quarter. Edgrapi labels every position new, added, reduced, or unchanged, and lists exits separately, with the diff on by default. To find what a fund started buying, scan the response for positions tagged "new"; to find what it dumped, read the exits. Because 13F updates quarterly, one scheduled pull after each 45-day deadline keeps a tracker current.
Why do 13F filings use CUSIPs instead of tickers?
Because the SEC identifies securities by CUSIP, a nine-character code, not by ticker. A raw 13F information table gives you the CUSIP and issuer name, so you need a CUSIP-to-ticker crosswalk to make it readable, and that mapping is incomplete for bonds and foreign issues. Large funds also file through sub-managers, so one holding can appear in several rows that must be summed. A good API resolves tickers and aggregates those duplicates for you.
Do 13F filings show short positions?
No. Form 13F is long-only, so it discloses long US equity positions and options but never short positions. A fund that is net bearish can still look bullish from its 13F alone. It can also list put options, which are bearish bets, not ownership, so a holdings feed that doesn't flag puts and calls will mislead you. Treat 13F as a partial, long-only view of a manager's book.
How current is 13F holdings data?
It is a lagged quarterly snapshot, not real-time. Managers have up to 45 days after a quarter ends to file, so a position dated June 30 might not appear until mid-August, and the fund may have already changed it. New data lands roughly in mid-February, May, August, and November. 13F is history you can analyze, not a live trade feed you can follow tick by tick.