SEC EDGAR API With pandas: Load Company Financials Into a DataFrame (2026)
You want ten companies' revenue and margins in a pandas DataFrame. You expect five lines. You get a nested JSON tree instead.
The SEC publishes every number for free, but its companyfacts JSON buries each figure under XBRL tags, unit blocks, and period arrays. Point pandas at it raw and you get columns you never asked for and no net income anywhere in sight.
So here is how to get SEC financials into a DataFrame the short way, and why the raw file makes you work for it.
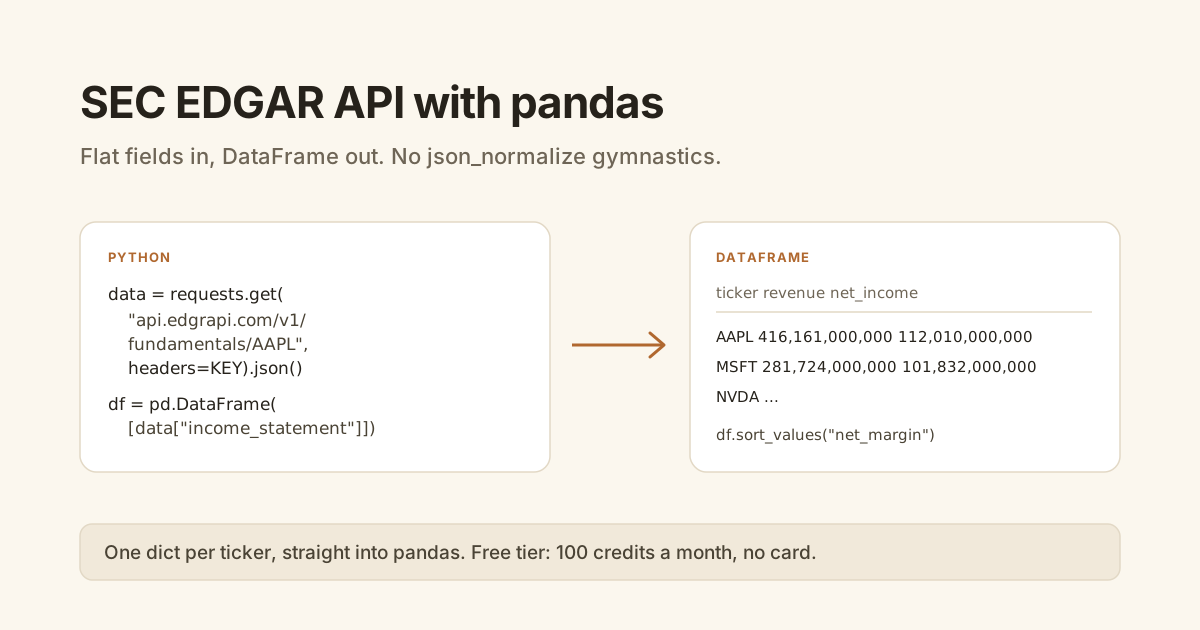
pd.DataFrame. Raw data.sec.gov companyfacts is deeply nested XBRL, so pd.json_normalize flattens the shape but still leaves you picking tags and deduping periods by hand. One call to api.edgrapi.com/v1/fundamentals/AAPL returns income statement, balance sheet, and cash flow as flat fields that drop straight into a DataFrame. The free tier is 100 credits a month, no card.Can you load SEC EDGAR data into a pandas DataFrame?
Yes. A DataFrame is happiest with a list of flat dictionaries, one per row, so the whole job is getting SEC financials into that shape. If your source already returns flat named fields, it is one line: pd.DataFrame(records). The work is not pandas. It is turning the SEC's nested XBRL into flat records before pandas ever sees it.
Once the data is flat, everything downstream is normal pandas:
import pandas as pd

records = [
    {"ticker": "AAPL", "revenue": 416161000000, "net_income": 112010000000},
    {"ticker": "MSFT", "revenue": 281724000000, "net_income": 101832000000},
]
df = pd.DataFrame(records)
print(df)
So the real question is where those flat records come from.
Why is raw SEC companyfacts hard to get into a DataFrame?
Because companyfacts is deeply nested and organized around XBRL tags, not statements. A single figure lives under facts → us-gaap → [tag] → units → USD as an array of period objects. pandas.json_normalize can flatten that shape, but flattening is not the same as getting a clean income statement out.
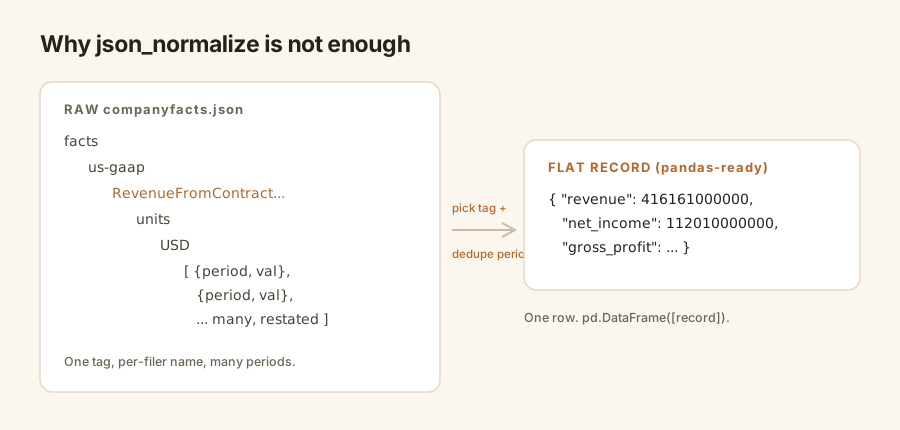
Two problems survive the flattening. First, json_normalize gives you one XBRL tag at a time, and the same line item is tagged differently per filer, so Apple's revenue is RevenueFromContractWithCustomerExcludingAssessedTax, not Revenues. Second, each tag holds many overlapping periods and restatements, so you dedupe by period-end yourself.
import requests, pandas as pd

facts = requests.get(
    "https://data.sec.gov/api/xbrl/companyfacts/CIK0000320193.json",
    headers={"User-Agent": "Your Name you@example.com"},
).json()

rev = facts["facts"]["us-gaap"]["RevenueFromContractWithCustomerExcludingAssessedTax"]
df = pd.json_normalize(rev["units"]["USD"])   # one tag, many periods, still no net_income
That DataFrame is one line item for one company. Build a real statement and you are writing a tag map and a period filter before pandas does anything useful. And per the SEC's fair-access rules, every one of those requests needs a descriptive User-Agent or you get a 403, and you stay under 10 requests a second per IP.
How do you load clean financials into a DataFrame in a few lines?
You call an endpoint that returns the statements as flat named fields, then hand them to pd.DataFrame. With Edgrapi that is one GET to /v1/fundamentals/{ticker} with your key in the X-API-Key header. The income statement comes back as a list of periods, so passing it straight to pd.DataFrame gives you a row per period, which is a single row when you ask for limit=1.
import requests, pandas as pd

KEY = {"X-API-Key": "edgr_your_key"}

data = requests.get(
    "https://api.edgrapi.com/v1/fundamentals/AAPL",
    headers=KEY, params={"period": "annual", "limit": 1},
).json()

df = pd.DataFrame(data["income_statement"])
print(df[["revenue", "net_income"]])
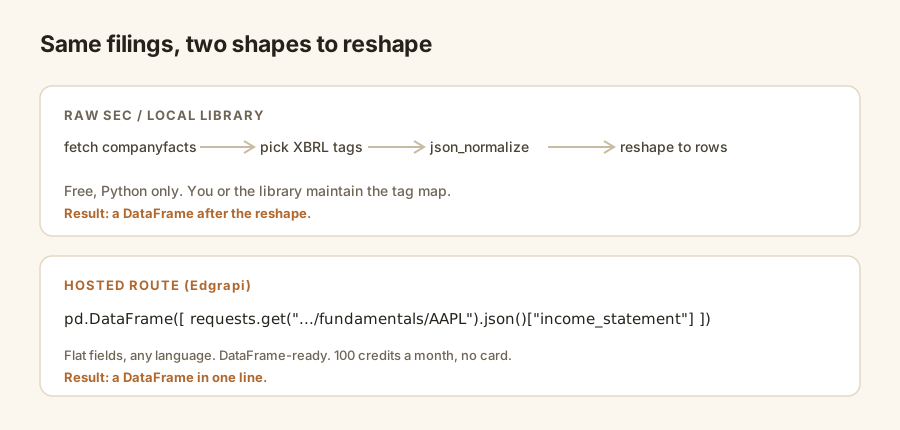
To be fair to the free route: the open-source edgartools library does this well for local Python, with financials.income_statement().to_dataframe(). It is a good fit when you live in Python and pull a handful of companies. The hosted call earns its keep when you want flat fields from any language, or you are pulling many tickers on a schedule and would rather not maintain a tag map yourself.
| Concern | Raw SEC / local library | Hosted route (Edgrapi) |
|---|---|---|
| Setup | Install a library or write a parser | One HTTP call, no dependency |
| XBRL tags | You or the library map them | Normalized server-side |
| Shape for pandas | json_normalize, then reshape | Flat records, DataFrame-ready |
| Many tickers | You throttle under 10 req/s per IP | Handled server-side |
| Language | Python only | Any language, same JSON |
How do you build a multi-ticker screener DataFrame?
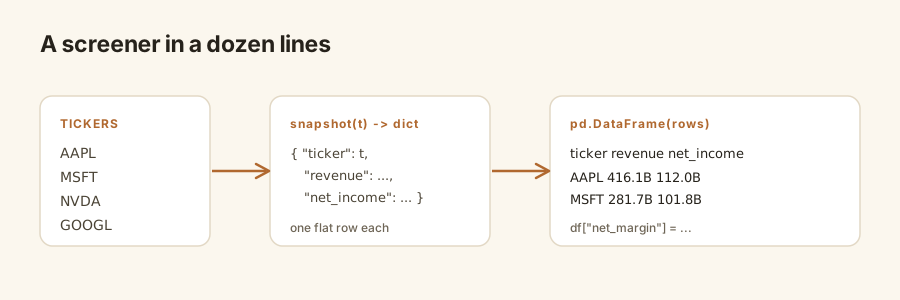
You call the fundamentals endpoint for each ticker, return one flat dict per company, and pass the whole list to pd.DataFrame. Because every response has the same named fields, the rows line up with no reshaping, and you can add computed columns like margin right on the DataFrame.
import requests, pandas as pd

KEY = {"X-API-Key": "edgr_your_key"}

def snapshot(ticker):
    d = requests.get(f"https://api.edgrapi.com/v1/fundamentals/{ticker}",
                     headers=KEY, params={"period": "annual", "limit": 1}).json()
    inc = d["income_statement"][0]
    return {"ticker": ticker, "revenue": inc["revenue"], "net_income": inc["net_income"]}

tickers = ["AAPL", "MSFT", "NVDA", "GOOGL"]
df = pd.DataFrame(snapshot(t) for t in tickers)
df["net_margin"] = df["net_income"] / df["revenue"]
print(df.sort_values("net_margin", ascending=False))
That is a working screener in a dozen lines. Every company is a row, and net margin sorts them.
How do you add ratios and screen the DataFrame?
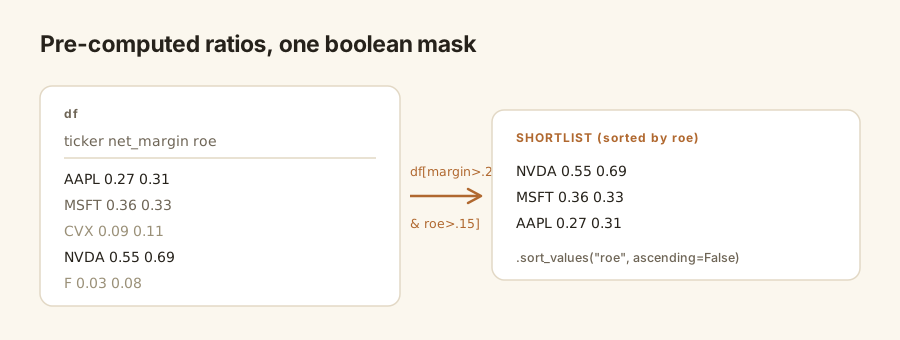
You pull the ratios endpoint alongside fundamentals so each row carries pre-computed metrics, then filter the DataFrame with a boolean mask. Ratios like net margin, ROE, and debt-to-equity come ready, so you screen on them directly instead of deriving them from raw statements.
BASE = "https://api.edgrapi.com/v1"

def row(ticker):
    f = requests.get(f"{BASE}/fundamentals/{ticker}", headers=KEY,
                     params={"limit": 1}).json()
    r = requests.get(f"{BASE}/ratios/{ticker}", headers=KEY).json()
    return {"ticker": ticker,
            "revenue": f["income_statement"][0]["revenue"],
            "net_margin": r["ratios"]["net_margin"], "roe": r["ratios"]["return_on_equity"]}

df = pd.DataFrame(row(t) for t in tickers)
screen = df[(df.net_margin > 0.20) & (df.roe > 0.15)].sort_values("roe", ascending=False)
print(screen)
Ratios get their own ratios guide, and the endpoint pattern is the same for every path, covered in the Python guide.
How do you export the DataFrame to CSV or a notebook?
You use the pandas methods you already know. A screener DataFrame writes to CSV with df.to_csv, drops into Excel the same way, and renders as a table in a Jupyter or Colab notebook just by putting the variable on the last line. Nothing about the Edgrapi source changes that step; the data arrived as an ordinary DataFrame.
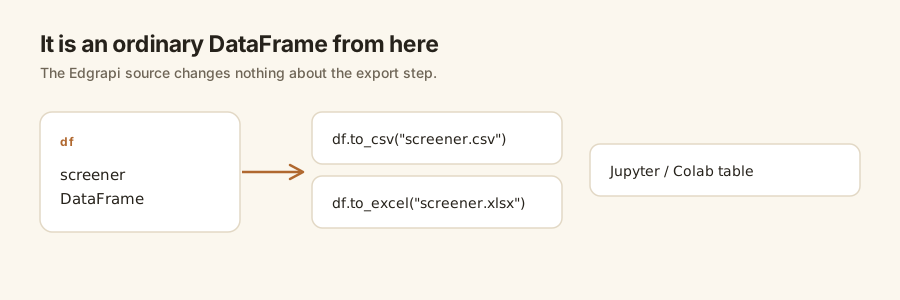
screen.to_csv("screener.csv", index=False) # or df.to_excel("screener.xlsx")
From here it is a normal notebook: plot the margins, join another DataFrame, or schedule the script to refresh the CSV each quarter.
Build your first screener DataFrame
Grab a free key, run the four-ticker snapshot above, and sort by net margin. If the rows come back sorted, you have a screener you can extend to a hundred tickers.
The free tier is 100 credits a month, no card, which covers a small watchlist end to end. Point requests at https://api.edgrapi.com and build your first DataFrame. The endpoints are in the docs, and the complete SEC EDGAR API guide covers the rest of the filing types.
Frequently asked questions
How do I load SEC EDGAR financials into a pandas DataFrame?
Get the statements as flat named fields and pass a list of them to pd.DataFrame. The SEC's raw companyfacts JSON is nested XBRL, so you would normalize it and pick tags first. A single call to api.edgrapi.com/v1/fundamentals/AAPL returns the income statement as a flat object, so pd.DataFrame([data['income_statement']]) gives you a one-row DataFrame with no reshaping.
How do I get SEC company data into pandas without parsing XBRL?
Use a hosted API that normalizes the XBRL server-side. Raw companyfacts tags the same line item differently per filer, so pd.json_normalize flattens the shape but still leaves you choosing tags and deduping periods. Edgrapi's fundamentals endpoint returns flat named fields, so the data reaches pandas already shaped as rows, with no tag map in your code.
How do I build a stock screener from SEC data with pandas?
Call the fundamentals endpoint for each ticker, return one flat dict per company, and pass the list to pd.DataFrame. Because every response shares the same fields, the rows align with no reshaping. Add computed columns like net margin, then filter with a boolean mask and sort. That is a working screener in about a dozen lines of pandas.
How do I put multiple tickers into one DataFrame?
Loop over your tickers, collect one dict per company into a list, and hand the list to pd.DataFrame in a single call. Since the fundamentals response is flat named fields rather than nested XBRL, the list builds a tidy DataFrame with one row per ticker and no per-company special cases. You can then add derived columns across the whole frame.
Is there a free SEC EDGAR API that works with pandas?
The SEC's data.sec.gov is free with no key, and the open-source edgartools library wraps it well for local Python. Edgrapi's free tier is 100 credits a month, no card, and returns flat JSON that drops straight into pd.DataFrame from any language. Use the local library for Python-only scripts and the hosted API when you want language-agnostic flat fields or many tickers on a schedule.
How do I export a pandas DataFrame to CSV or Excel?
Use the pandas methods you already have: df.to_csv('file.csv', index=False) writes CSV, and df.to_excel('file.xlsx') writes Excel. Because the Edgrapi data arrived as an ordinary DataFrame, nothing about the source changes the export. In a Jupyter or Colab notebook, putting the DataFrame on the last line renders it as a table.