Build a Stock Screener With the SEC EDGAR API (2026)
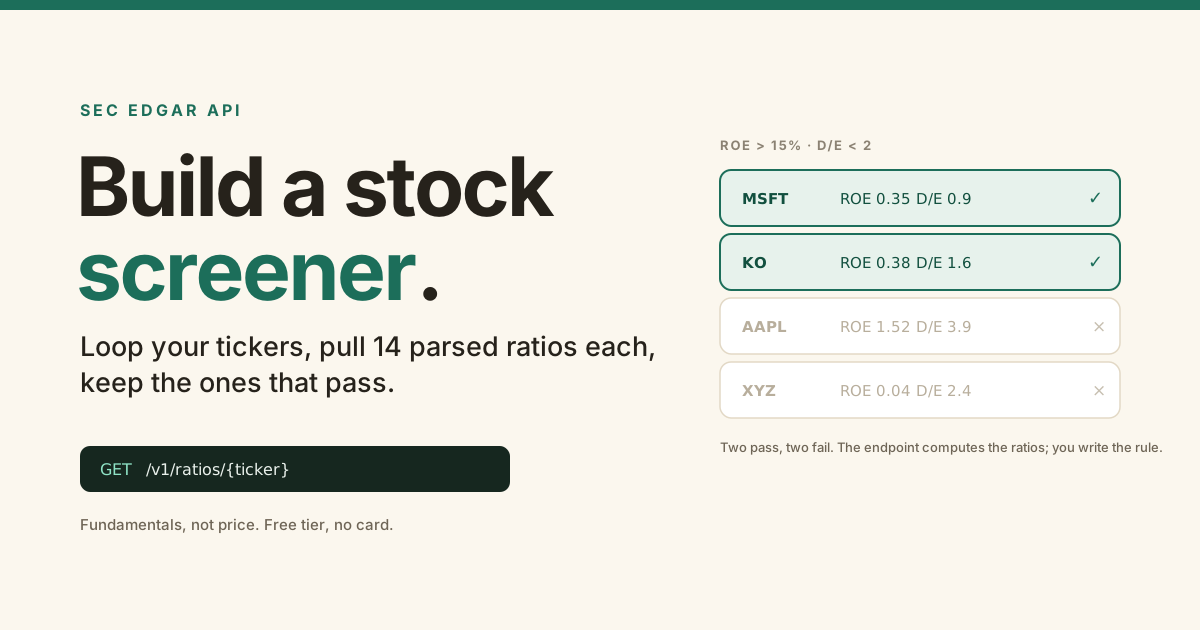
A stock screener sounds hard to build. The screening part is a for-loop and an if-statement.
The hard part is getting metrics you can actually trust for every company, and that is where SEC data fights you.
Here is how to build a working fundamental screener on the SEC EDGAR API: what you can and cannot screen on, the parsed ratios that make the filter trustworthy, and a dozen lines of Python that run it over a watchlist.
GET /v1/ratios/{ticker} returns 14 parsed fundamental ratios per company, margins, returns, leverage and growth, computed from SEC filings with the XBRL traps handled. You filter on numbers you can trust. It screens on fundamentals, not price, and one ticker per call.What is a stock screener, really?
A stock screener takes a list of companies, pulls a set of metrics for each, and returns the ones that pass your rules. Return on equity above 15 percent, net margin above 20, debt-to-equity under 1: those are filters over a table. The mechanics are a loop and a comparison. Screeners are hard for one reason only, the table itself, getting correct and comparable metrics for every company on the list.
Think about where that table comes from.
The SEC gives you raw filings, not a spreadsheet of ratios. Every company's numbers are in there, but under inconsistent XBRL tags, in different units across eras, with the ratios left for you to compute. Build the screen on that directly and your filter is only as honest as your parsing.
What can you screen on with SEC data?
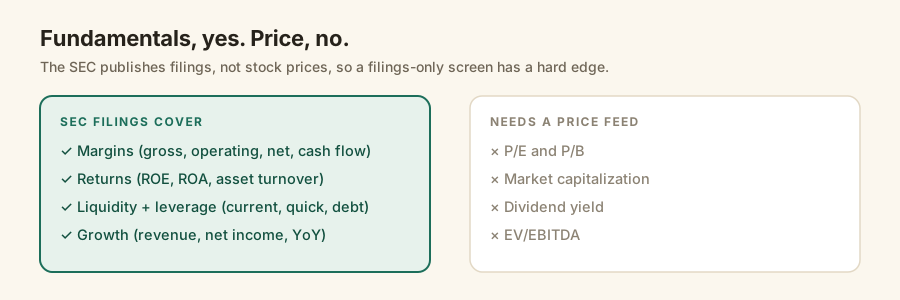
Fundamentals, not price. From SEC filings you can screen on profitability (gross, operating and net margin), returns (return on equity and assets), leverage (debt-to-equity and debt-to-assets), liquidity (current and quick ratio), and growth (revenue and net income, year over year). What you cannot screen on from filings alone is anything price-based, because the SEC does not publish a stock price. P/E, market cap and dividend yield all need a separate market-data feed.
This is the honest boundary, and it is worth being clear about it up front.
A screen built on SEC data answers "which companies are profitable, growing, and not drowning in debt," not "which are cheap." For the cheap part you add a price source and join it on. These fundamental filters are the same profitability, financial-health and growth criteria the mainstream screeners expose, per Investing.com's stock screener. Edgrapi's /v1/ratios returns the 14 of them below, computed for you.
| Group | Ratios you can screen on |
|---|---|
| Profitability | gross_margin, operating_margin, net_margin, operating_cash_flow_margin, free_cash_flow_margin |
| Returns | return_on_equity, return_on_assets, asset_turnover |
| Liquidity | current_ratio, quick_ratio |
| Leverage | debt_to_equity, debt_to_assets |
| Growth (YoY) | revenue_growth_yoy, net_income_growth_yoy |
How do you pull the metrics for one company?
One call. GET /v1/ratios/{ticker} returns those 14 ratios for a company, already computed from its latest annual filing. You do not parse XBRL, resolve tags, or do the arithmetic: revenue is resolved across its candidate tags, the units are right, and net_margin is simply there as a number. That is the piece that makes a screen trustworthy, because every company's ratios are computed the same way.
import requests

r = requests.get(
    "https://api.edgrapi.com/v1/ratios/AAPL",
    headers={"X-API-Key": "edgr_your_key"},
)
d = r.json()["ratios"]
print(d["net_margin"], d["return_on_equity"], d["debt_to_equity"])
# 0.27 1.52 3.87
The values come back as decimals: a net_margin of 0.27 is a 27 percent margin. Apple's return on equity of 1.52, meaning 152 percent, is real rather than a parsing error: years of buybacks have shrunk its equity base, and a screen has to handle figures like that honestly. Because the ratios are derived from parsed statements, a company that tags revenue the old way returns a number just like one that tags it the modern way, which is exactly what a screen needs.
How do you screen a whole watchlist?
Loop the tickers, pull each one's ratios, and filter. Call /v1/ratios for every company in your universe, collect the results into a table, and keep the rows that pass your rules. It is about a dozen lines of Python, and the screen is only as good as the metrics behind it, which is the reason to pull them from an endpoint that computes them consistently.
import requests, pandas as pd

TICKERS = ["AAPL", "MSFT", "NVDA", "KO", "JPM", "XOM", "PG", "WMT"]
HEAD = {"X-API-Key": "edgr_your_key"}

rows = []
for t in TICKERS:
    r = requests.get(f"https://api.edgrapi.com/v1/ratios/{t}", headers=HEAD)
    d = r.json().get("ratios")
    if d:
        d["ticker"] = t
        rows.append(d)

df = pd.DataFrame(rows)

# quality-at-a-reasonable-balance-sheet screen
screen = df[
    (df["return_on_equity"] > 0.15) &
    (df["net_margin"] > 0.15) &
    (df["debt_to_equity"] < 2.0) &
    (df["revenue_growth_yoy"] > 0.05)
].sort_values("return_on_equity", ascending=False)

print(screen[["ticker", "return_on_equity", "net_margin", "debt_to_equity"]])
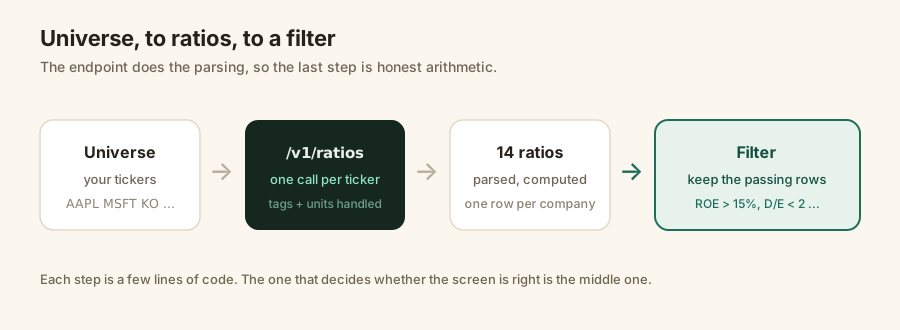
Swap the tickers for your own universe and the four conditions for your own rules. That is a screener, in Python with a pandas frame doing the filtering; the general build pattern is the same one the screener tutorials describe, minus the part where you write the parser. Everything else, ranking, weighting, sector caps, is arithmetic on the same table.
Why do your screen results need correct data?
Because a screen amplifies bad data. If revenue comes back null for a company because it tagged the line under a different XBRL concept, that company silently drops out of every margin and growth filter, and you never notice the gap. If a ratio is computed on the wrong tag or the wrong units, it passes or fails your rule for the wrong reason. A filter over wrong numbers returns a confidently wrong list.
This is the whole case for computing the ratios once, correctly.
Edgrapi resolves each metric across its candidate XBRL tags and handles the units before it computes a ratio, so the number you filter on is the right one. If you want the detail on those traps, the guide to why clean JSON is not correct JSON walks all four, and the financial ratios reference lists every field.
What are the limits of an SEC screener?
Two honest ones. Edgrapi is per-ticker, so a screen is one call per company: a 500-name universe is 500 calls, which costs credits and takes time under the rate limit, so screen a curated list or paginate rather than sweeping the whole market on a whim. And it is fundamentals only, so price-based filters like P/E and market cap need your own price feed joined on. Within those bounds you get correct, computed ratios for any US filer, free to start.
The per-ticker point is the one that shapes your design.
A focused universe, a sector, an index list, or your own watchlist, is where a fundamental screen earns its keep anyway. You are not trying to rank all 10,000 tickers every morning; you are filtering a list you already care about down to the names that pass.
Start: screen five tickers
Pick five companies you follow, loop /v1/ratios over them, and print the ones with return on equity over 15 percent. You will have a working screen in a few minutes, and the ratios behind it are computed the same way for every name, so the comparison is fair.
The free tier is 50 credits, no card, which covers building and testing the screen. Point it at https://api.edgrapi.com, start with a watchlist, and widen the universe once the filter does what you want.
Frequently asked questions
How do I build a stock screener with an API?
Three steps: choose a universe of tickers, pull each company's metrics from the API, and keep the ones that pass your filters. With Edgrapi you call GET /v1/ratios for each ticker, collect the 14 returned ratios into a table, and filter on rules like return on equity over 15 percent or debt-to-equity under 2. It is about a dozen lines of Python.
What can I screen stocks on with SEC data?
Fundamentals: profit margins, return on equity and assets, current and quick ratios, debt-to-equity and debt-to-assets, and revenue and net income growth year over year. You cannot screen on price-based metrics like P/E, market cap or dividend yield from filings alone, because the SEC does not publish a stock price; those need a separate market feed.
Can the SEC EDGAR API screen the whole market in one call?
No. Edgrapi is per-ticker, so a screen is one /v1/ratios call per company. Screening a 500-name universe is 500 calls, which costs credits and takes time under the rate limit. In practice you screen a curated list, a sector, an index, or your own watchlist, rather than sweeping all 10,000 tickers at once.
Can I screen on P/E or market cap?
Not from SEC filings alone. Price-to-earnings, market capitalization and dividend yield all depend on a live stock price, which the SEC does not publish. Edgrapi returns the fundamental side, margins, returns, leverage and growth; to add price-based filters you join a market-data feed onto the same table.
Is there a free stock screener API?
Edgrapi has a free tier of 50 credits with no card, which is enough to build and test a fundamental screen over a watchlist. Each /v1/ratios call costs a few credits, so a large universe uses more; the free tier covers development, and paid plans cover running it at scale.
How many tickers can I screen at once?
As many as you loop over, one /v1/ratios call each. There is no bulk screen endpoint, so the practical limit is your rate budget and credits: a focused universe of a few dozen to a few hundred names runs quickly, while sweeping thousands means pacing the calls and spending more credits.